ColorQPC
ErgoSoft ColorQPC is Ergosofts color quality and process control solution to monitor and certify color results from digital printing systems. ColorQPC generates standardized charts to measure and the measurement results can then be used in a variety of ways to quality control your digital printing workflows:
- Check the color accuracy of your printer profile.
- Check for potential color differences after changing ink and/media lots or after a printer maintenance.
- Ensure critical spot colors for production jobs are printed correctly.
- Certify that a printer, ink and media combination achieve color output to a specific printing standard.
ColorQPC consists of three modules: Predict and Simulate, Measure and Compare and Analyze and Monitor.
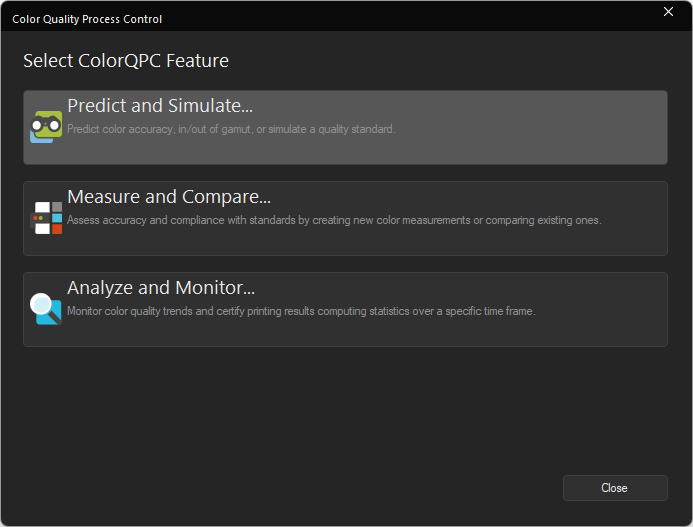
Predict and Simulate predicts the color accuracy of a SwatchBook and in-/out of gamut prediction of the selected printer profiles and simulate a color control strip based on color quality industry/corporate standards without actually printing anything.
Measure and Compare prints and measures a set of colors from a Swatch Book or Named Colors recipe and checks whether the printed colors fall within preset color tolerances.
Analyze and Monitor provides quality departments and production managers with an overall summary of color process control information.
All ColorQPC modules include options for color process control comparisons, either to an expected set of color values, or to measurement results from previous production runs. With the color-coded HTML reports, it’s easy to identify which colors or production jobs are outside the required color tolerances.
ColorQPC is included in ErgoSoft RIP 17 JobComposer Production Editions and works with all supported color measurement devices.
Predict and Simulate
Predicts the color accuracy of a SwatchBook and in-/out of gamut prediction of the selected printer profiles and simulate a color control strip based on color quality industry/corporate standards without actually printing anything.
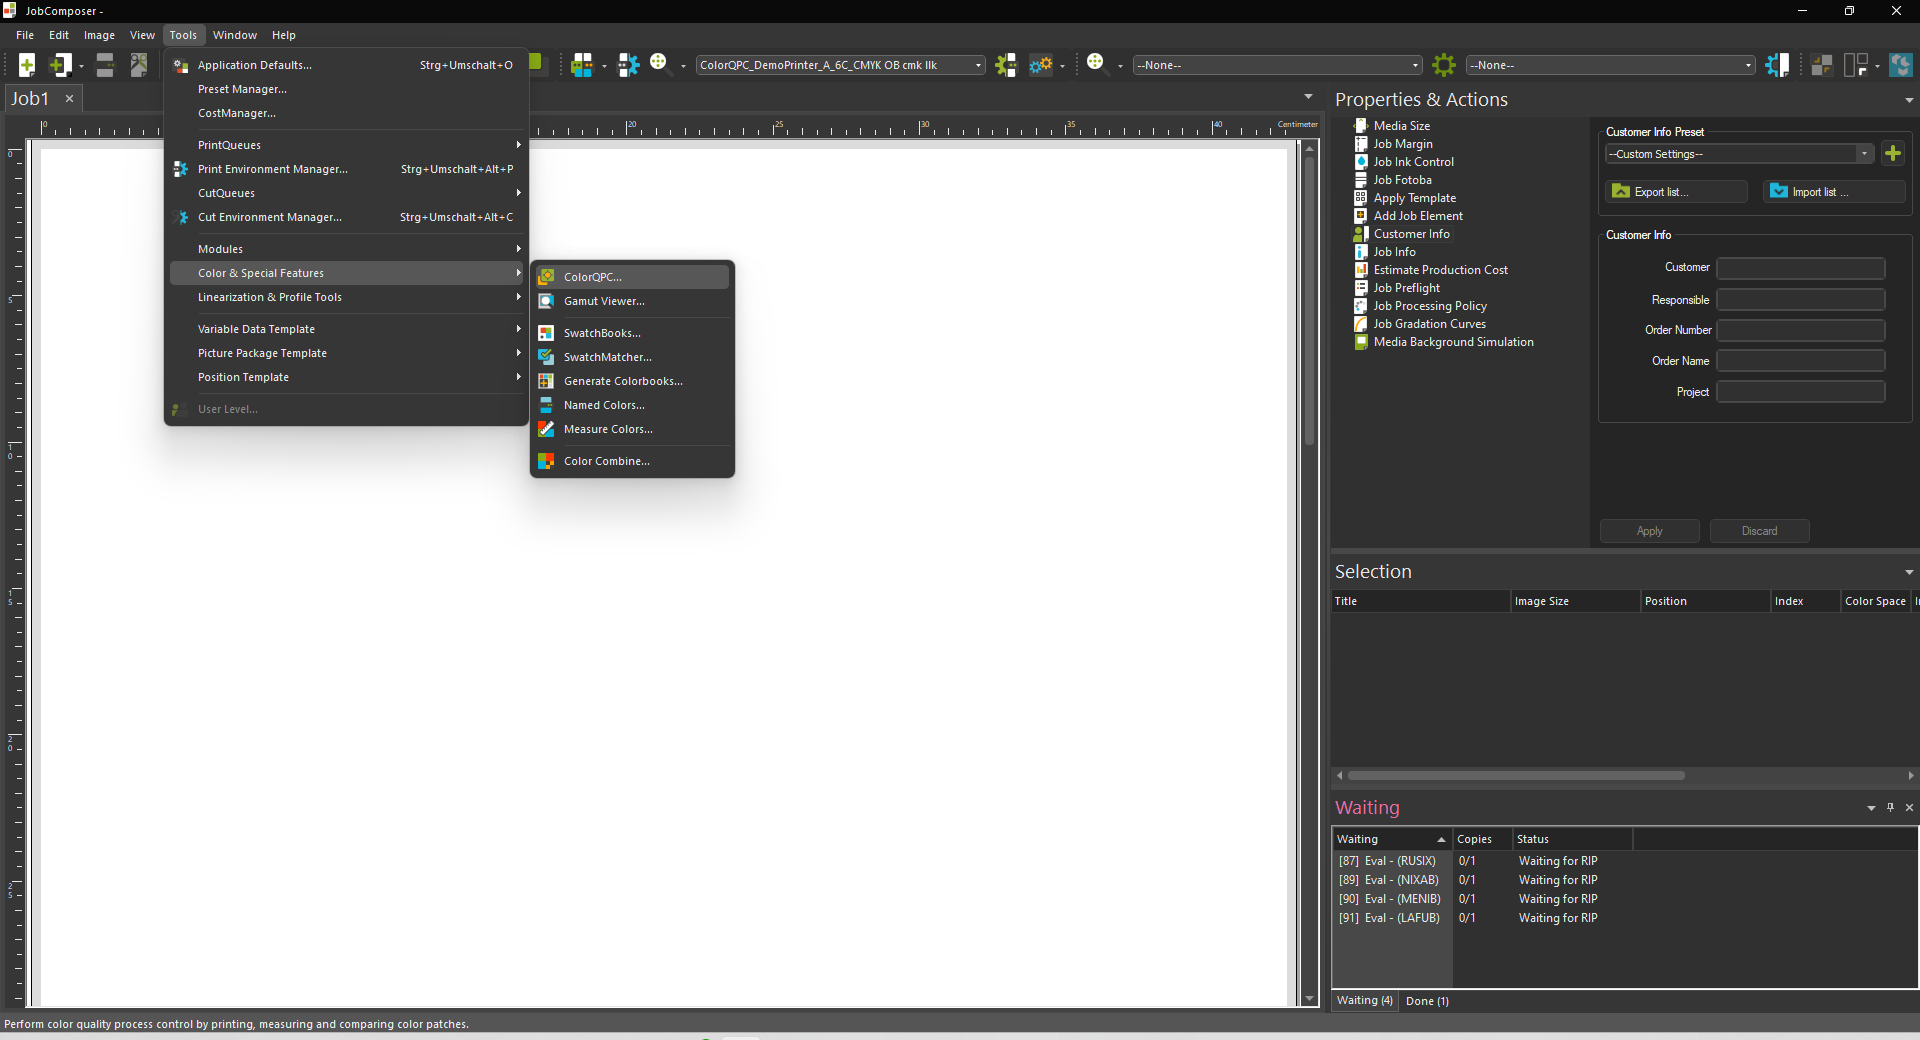
To launch ColorQPC Predict and Simulate, go to Tools > Color & Special Features > ColorQPC. In the ColorQPC dialog, select Predict and Simulate.
After the Predict and Simulate window has opened, select what you want to compare your profile against. You can use either a Swatchbook or one of the preinstalled ColorQPC Presets.
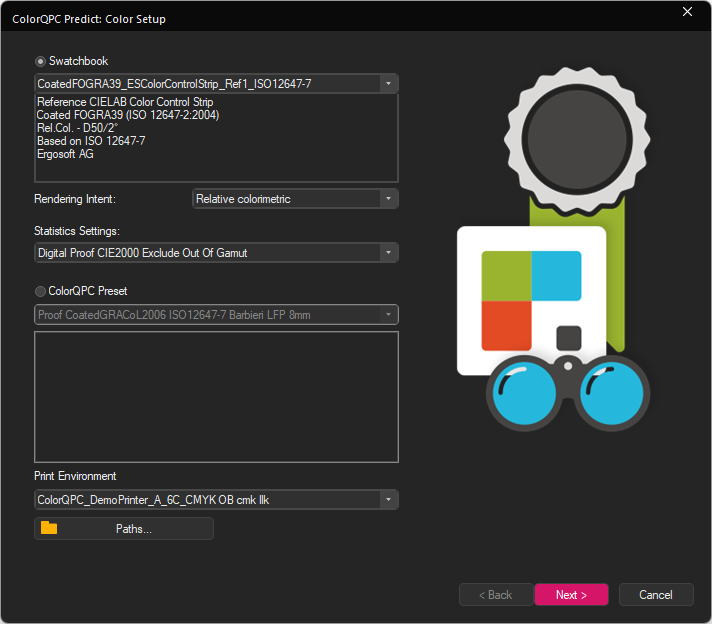
Swatchbook: Select one of the Swatchbooks in this Ergosoft 17 installation, the Rendering Intent that should be applied, and the Statistics Setting. The Statistics Setting defines the criteria by which the color prediction is judged, i.e. when colors pass or fail the prediction. You can set up new Statistics settings in ColorQPC Measure.
Additional Swatchbooks can be added through the Ergosoft Swatchbook by clicking on Import and in the navigation pane of the windows explorer window select Ergosoft RIP > Recommended. By adding these in Swatchbooks, they will then also be available in ColorQPC Predict and Simulate to generate control strips.
Available new control strips / characterization sets are: Coated FOGRA51 (ISO 12647-2), Coated FOGRA39 (ISO 12647-2), Coated FOGRA27 (ISO 12647-2), Coated GRACoL 2006 (ISO 12647-2), U.S. Web Coated (SWOP) v2)
ColorQPC Preset: Select one of the available ColorQPC Presets to compare your color profile against. You can create new ColorQPC Presets in the Measure and Compare Module of ColorQPC.
Select the Print Environment/Profile that you want to compare to either the Swatchbook or ColorQPC Preset in the bottom dropdown menu.
Paths lets you customize the path where ColorQPC Data is saved and where the reports are exported to. You can also use Paths to export and import data e.g. to synchonize ColorQPC data between different Ergosoft 17 installations.
When you are satisfied with your settings, click Next to simulate the comparision and see the report. ColorQPC will show a window with the simulation results and show wether the simulation passed or failed (If color accuracy is within the set parameters). Click the Show Report button to open an in depth HTML report of the simulation in your default browser.
When you are done click Finish to close the Predict and Simulate window.
ColorQPC Measure and Compare
Creating a New ColorQPS Measurement Session
ErgoSoft ColorQPC Measure prints and measures a set of colors from a Swatch Book or Named Colors recipe and checks whether the printed colors fall inside preset color tolerances.
Customizable color difference statistics and summary results are reported on screen and as an HTML document for easy assessment of the results. Adjust warning and fail tolerances to alert you when colors are off. This ensures and certifies that the printed output meets your color requirements and therefore reduces production waste from faulty printouts.
Use ColorQPCs special reporting features to test if specific colors are inside the printer’s printable gamut and, if required, exclude these colors from quality statistics.
To launch ColorQPC Measure, go to Tools > Color & Special Features > ColorQPC. Then open Measure and compare.
Starting a New Measure Session
To begin evaluating a printing process, you will want to start a new ColorQPC session. A session within ColorQPC Measure describes the process of printing a chart, measuring it and checking colors for accuracy. You will want to create a new session for every workflow you want to control, but one session can have multiple measurements.
Setup
Open ColorQPC measure and select New ColorQPC Measure Session at the top.

The ColorQPC Setting menu lets you specify the different parameters for your ColorQPC session, such as which Swatchbook or Named Color profile to base the chart on, Measurement Device Geometry (Chart Format), chart size, rendering intent, etc.
There are several predefined configurations covering the most common use cases, but you can also use the Edit button to the right to configure your ColorQPC settings manually. If you want to use a specific Swatchbook or named color profile for the session, you’ll may need to edit or add a preset to use that colorbook.
For more information on the custom ColorQPC settings available, check the ColorQPC Setup Details section further down in this article.
After selecting an option, the information window shows a summary of the parameters of each mode. Select or configure the setting you want to use.
For a new session, the Print Environment selection will be locked to the Print Environment that is active in the JobComposer when you launch ColorQPC Measure. Select ColorQPC Session will be also grayed out, as we are creating a new one.
The Paths button at the bottom lets you configure the save paths for your current session configuration and measurement data. Note that this setting only changes the path for the current session and is not a global setting.
When you are satisfied, click Next to continue.
Print a Chart
The ColorQPC chart for printing is automatically created according to the configuration of the selected ColorQPC Settings for the current measurement session. ColorQPC Measure automatically rotates charts for better media usage whenever possible.
Print Options provide additional options for printing the chart:
- Print multiple calibration charts across job width duplicates the calibration chart across the entire printing width so every second chart is rotated by 180°. This way you don’t have to reprint the chart if one chart is damaged.
- Print additional charts rotated 90° across job width is compatible with the previous option and adds a second row of calibration charts that is rotated by 90° respectively by 270°.
- When using the Edit job before printing option, a generated chart can be viewed and modified in the ErgoSoft RIP before printing. When using this option, close and save the session after printing. You’ll find the chart loaded as an image file in the job composer. Since print environment settings can be changed accidently before printing and in turn impact results, it is advisable to use this option carefully.
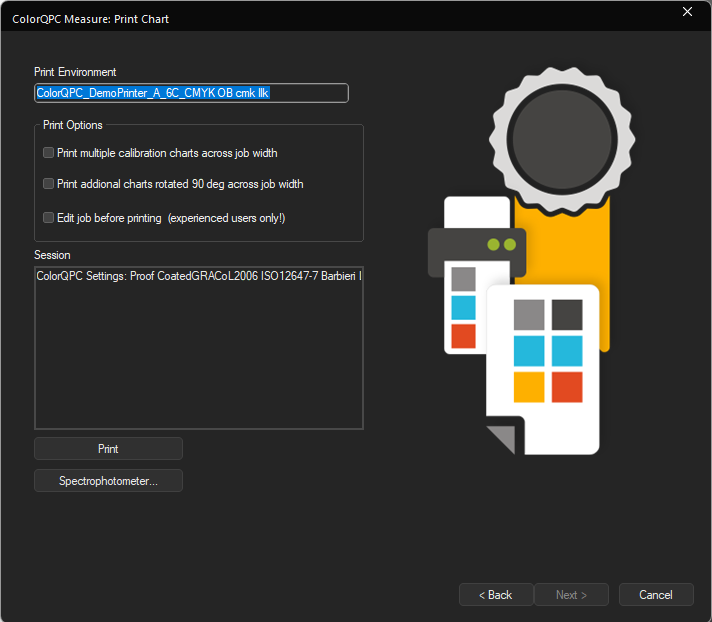
Click the Spectrophotometer button to change the measuring device to be used or if you have not previously detected the measurement device in Tools > Application Defaults.
When you are satisfied with your settings, click the Print button to print the chart.
Once the chart is printed, click the Next button to begin measuring. Clicking Cancel prompts to save the session as a file if a chart has been printed or exits the ColorQPC Measure module directly if no chart has been printed.
If you need to close the session for any reason, the saved session file can be reopened later in order to measure the printed chart.
Measure
Clicking on Next will automatically open the measurement window that you are likely already familiar with from measuring the density linearization and color profile.
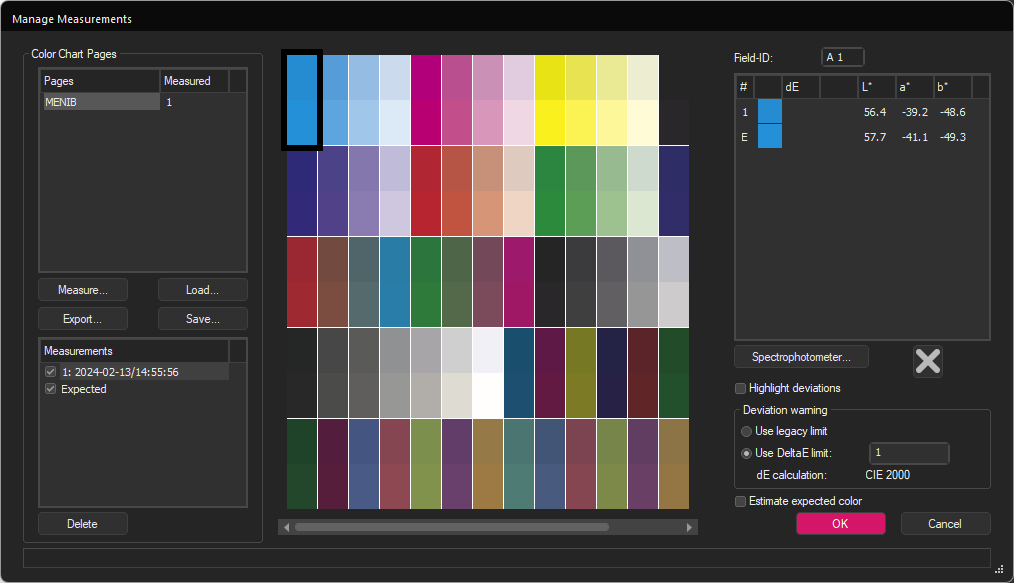
Click the Measure button to start the measurement. When the complete chart is measured, click OK to transfer the measurement into the Manage Measurements dialog.
We recommend performing minimum 3 measurements to be able to get a median measurement and minimize measurement errors (For more Information on the Measurement Dialog, please see the page “Density Linearization”).
If you need to interrupt your measuring session at any point, you can use the Save and Load buttons to save your measuring progress at any point and resume by reopening ColorQPC Measure, reloading your session and using the Load button to reload your measurement.
You can also use cancel at any point to abort the measurement and return to the ColorQPC Measure: Print Chart Dialog.
Note that the measurements are displayed in absolute colorimetric. When the ColorQPC Setting is defined with the relative colorimetric rendering intent, the displayed Lab values may vary from the actual measured Lab values. The rendering intent can be changed by editing the ColorQPC Settings in ColorQPC: Color Quality Setup > Color Settings > Edit > Color Chart.
Configure how to compare Measurements
After conducting your measurement and confirming with Ok, you’ll get to the Compare Measurements window. Here you’ll be able to configure the report that is generated from your measurements:
- Show Measurements only: Only the measurement values and out-of-gamut information are displayed.
- Compare with expected values: Compare the measurement session results to the expected Lab values for the test chart.
- Compare with another ColorQPC Measure session: Compare the measurement session results to a previous session (i.e. a “golden standard”). When using this option, select a print environment and another measure session for comparison in the respective dropdown menus at the bottom.
Click Next to continue. Clicking Cancel prompts either to save the session or discard the results.
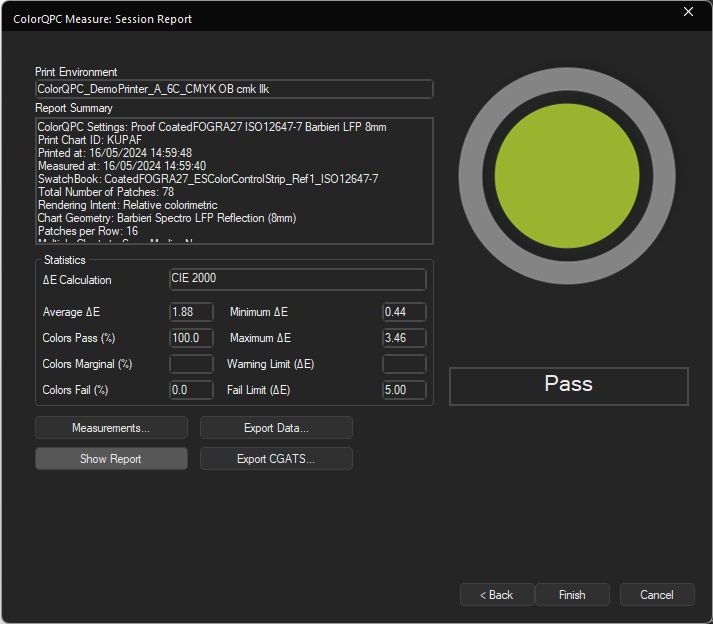
Measurement Session Report
The measurement session report dialog displays results based on the analysis method in the previous step.
The graphic on the right hand side and the textbox below will show an overall result of the measurement comparison based on the warning and fail delta E (dE) color limits defined in the ColorQPC Settings. There are 3 possible results here:
- Red: One or more color patches have a deviance higher than the fail limit.
- Yellow: One or more color patches have a deviance higher than the warning limit and no colors exceed the fail limit.
- Green: All color patches have deviances lower than warning and fail limits.
When the analyses are based on the Compare with expected values option, the warning and fail limits are based on the color differences between the measured values and expected Lab values for each color patch.
The Compare with another ColorQPC Measure session uses the warning and fail limits to compare the results between two measurement sessions.
No icon is displayed for the Show measurements only option.
The Statistics Segment shows overall statistics for the measurement session based on the ColorQPC Settings (This information is not displayed with the Show measurements only option).
Clicking the Measurements button redisplays the measurement dialog and allows you to re-measure of all or parts of the test chart.
Clicking the Show Report button creates an HTML report, automatically saves it, and displays it in the default web browser. Refer to the next step for more details about the report.
Clicking the Export Data button lets you save the measurement data in csv format.
Clicking the Back button returns to the Compare Measurements dialog. This provides the option to perform other comparisons using the session measurements.
When you are done, click the Finish button to close the ColorQPC Measure session and save the session information.
HTML Report
Clicking on the Show Report Button in the Measurement Session Report generates an HTML report of the measurement that displays an in-depth summary of the measurement and comparison:
The top half of the report displays information about the ColorQPC Measure session like the Print Environment, Statistics, overall Status (Red, Yellow, Green) and the ColorQPC Settings.
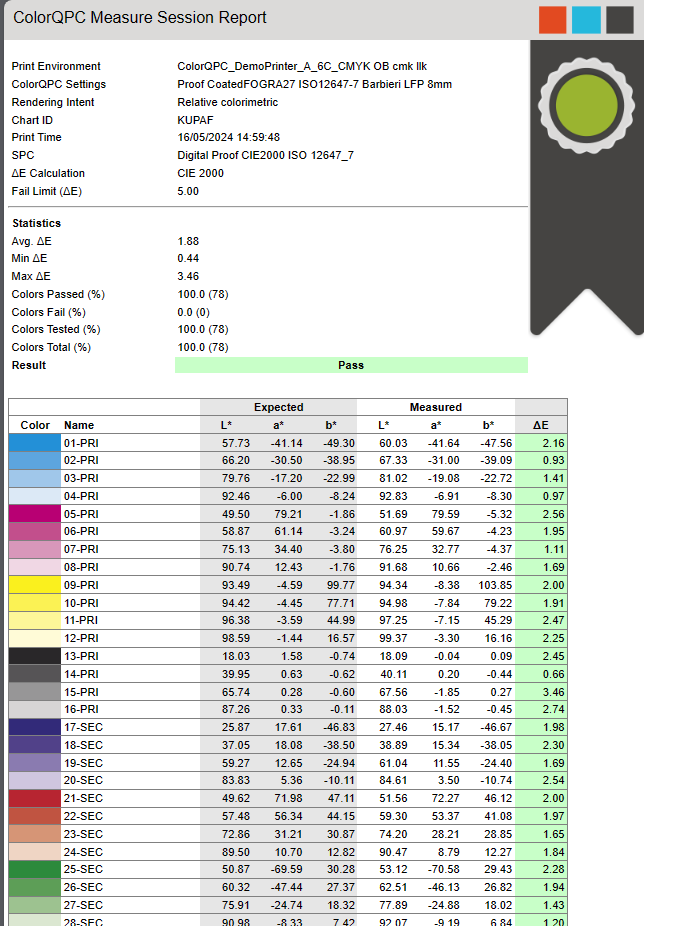
The table in the bottom section displays the list of colors printed including an approximate preview of the color, the name of the color defined in the Swatch book or Named Colors, the expected Lab values, the measured Lab values, and the color difference (dE) between the expected and measured results.
The color coding used in the color difference/dE column designates whether a color passed the evaluation:
- Gray indicates out-of-gamut colors (Only shown when comparing to expected values).
- Green indicates this color passed.
- Yellow indicates this color had a color deviance higher than the warning limit.
- Red indicates this color had a color deviance higher than the fail limit.
Loading an Existing Session
Sometimes you might want to load a previous saved session, e.g. to consult a value comparison again, because you had to interrupt a previous session, or to measure a chart you have previously printed but not measured yet.
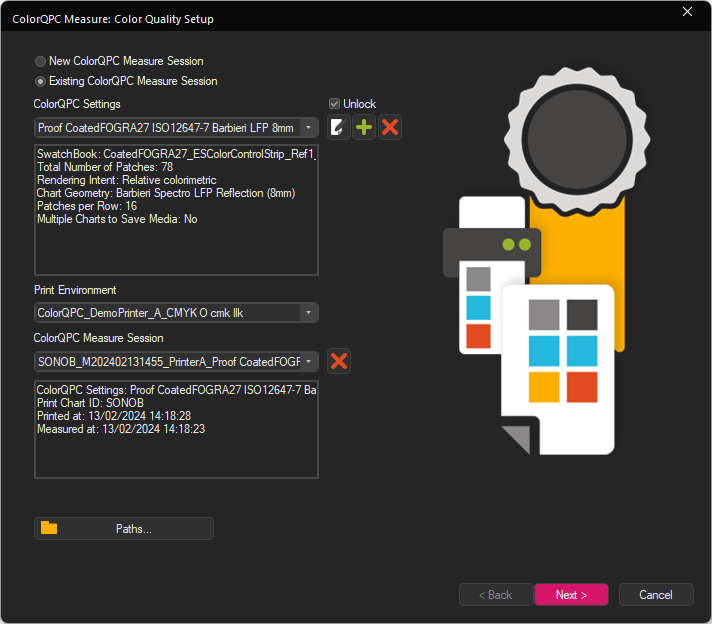
In the Color Quality Setup dialog, select Existing ColorQPC Measure Session.
Choose the ColorQPC Setting for which you want to load a ColorQPC Measure session. This must be the same setting as with the previous Session you want to use.
Select the desired Print Environment. Note that only print environments used with the selected ColorQPC settings will be displayed.
Select the ColorQPC Measure Session that you want to measure.
The ChartID and print date is displayed in the lower information field. Note that the measurement session list only shows sessions created with the selected print environment and ColorQPC Settings.
Clicking the Delete button next to the list will remove the selected ColorQPC Measure session from the system.
Click the Next button to continue.
To open a previous session, open ColorQPC by going to Tools > Color & Special Features > ColorQPC Measure.
If this session does not contain measurements or incomplete measurements, the Manage Measurements dialog will be displayed. Follow the steps starting at Measure in the New Session chapter of this article to complete the session.
If the session already contains a completed Measurement, the Compare Measurements dialog will be displayed. Follow the steps after starting at Configure how to compare Measurements in the New Session chapter of this article to complete the session.
ColorQPC Setup Details
Besides the preconfigured ColorQPC settings, you can also configure custom settings for your ColorQPC settings.
In the ColorQPC Measure: Color Quality Setup dialog, choose the ColorQPC Settings Edit or Create buttons to configure the ColorQPC settings for ColorQPC Measure.
Color Chart Tab
The top field displays the current print environment.
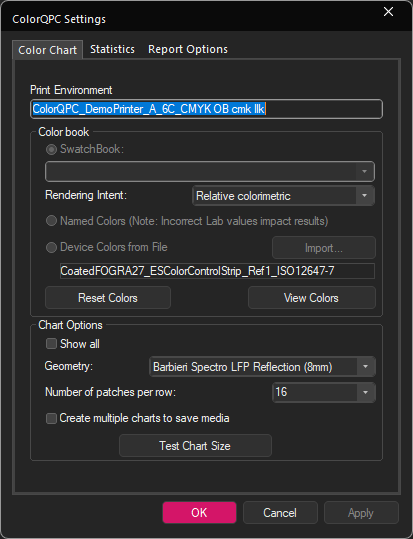
Select the Colorbook type you want to use to create the test chart. You can use either a Swatch Book or Named Colors Profile but note that the lab values of Named Colors may not be accurate and can impact the results.
Set whether to evaluate with either Absolute or Relative Colorimetric Rendering intent.
Reset colors when an alternative set of Swatch Books or Named Colors are required.
Note that once the ColorQPC Settings are saved, the current Swatch Book/Named Colors are stored for the ColorQPC Setting. If the Swatch Book or Named Colors are changed in the ErgoSoft RIP, these changes will not be updated in the list of stored colors.
View Colors pops up an HTML file to verify the colors and Lab values to be used for the chart.
Chart Options contains different settings related to the color chart itself:
Geometry sets the color measurement device and geometry to print and measure test chart.
The Number of patches per row can be selected for the color device. The pulldown provides a list of recommended numbers for the specific color measurement device and geometry.
Test Chart Size summarizes the number of charts and the number of rows/columns to be printed.
Statistics Tab
The statistics tab lets you configure different settings related to the statistics and evaluations applied to your measured results such as the deltaE calculation method, warning and failure levels for color differences and what colors should be evaluated for color accuracy.
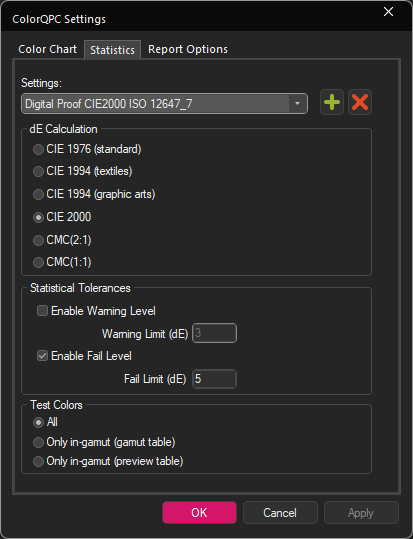
A set of statistics can be saved as a preset by clicking on the Add button or deleted with the Delete button.
Choose the desired Delta E Calculation method to use for reports.
In Statistical Tolerances, enable and choose the desired Warning and/or Fail Delta E limits. This specifies at what deltaE difference the measurement report will display a warning or a failure for a color.
Under Test Colors, you may choose whether the report is based on all colors or only in gamut colors.
Report Options Tab
With the settings in Report Options, you can add information to the Session to easily identify customers, order reference IDs, etc.
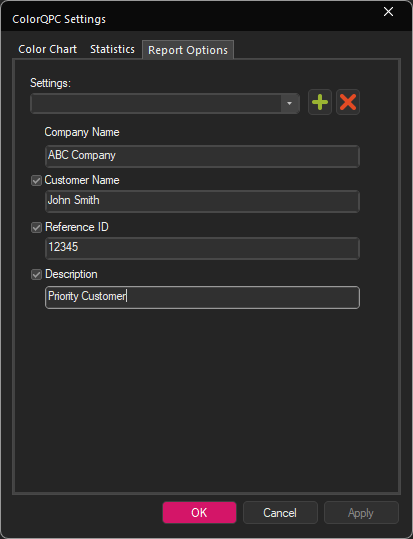
The Report Options can be saved as a preset to easily reuse them by clicking on the Add button or deleted with the Delete button.
Enter a Company name and activate and fill out the optional reporting fields to add them to the report.
Click OK and confirm again to save the ColorQPC settings and return to the ColorQPC Measure: Color Quality Setup dialog.
ColorQPC Analyze and Monitor
ColorQPC Analyze – Comparing Measurement Sessions
ErgoSoft ColorQPC™ Analyze provides quality departments and production managers with color process control information for their printers. ColorQPC Analyze compares historical color results from ColorQPC measure sessions through either for all print production jobs or for jobs run over a specific time frame. This makes it easy to monitor color quality trends and certify the color results from a given digital printing system.
Once you have a set of measurements from ColorQPC Measure, ColorQPC Analyze can use these measurement sessions to generate on-screen and HTML summary that shows where colors deviated from the previous values and clearly identifies the production runs that passed evaluation and those that showed color errors.
To launch ColorQPC Analyze, go to Tools > Color & Special Features > ColorQPC. Then select Analyze and Monitor.
Selecting the ColorQPC Sessions to Evaluate
To evaluate different sessions against each other, we’ll first need to select which ones we want to include.
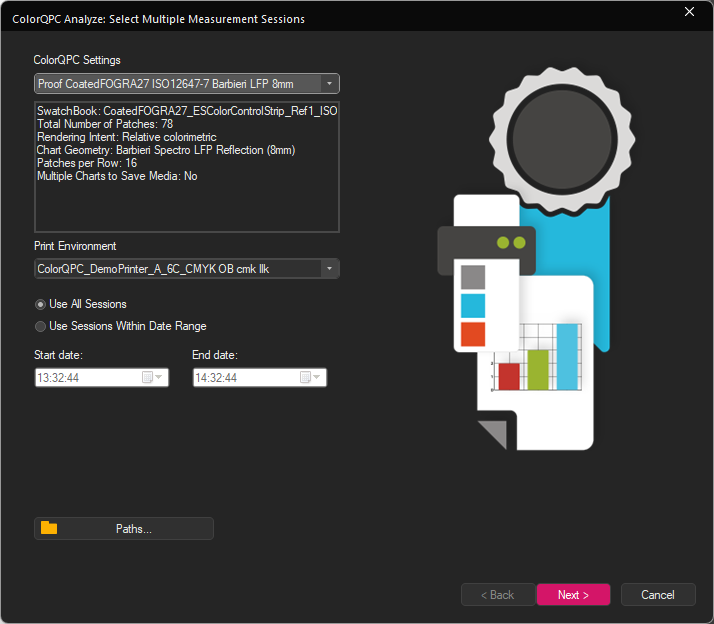
With ColorQPC Analyze open, first choose the ColorQPC Setting from the pull-down menu that you want to use for the current ColorQPC Analyze session.
Select the Print Environment for the ColorQPC Measure sessions you want to analyze. Note that only print environments used with the selected ColorQPC settings will be displayed.
Finally, select whether to analyze all sessions or sessions within a specific range of dates.
Clicking the button Paths lets you specify a custom save location for your ColorQPC data. Please note that this setting only saves reports and results for the current session and is not a global setting.
Click Next to continue.
Multiple Session On-Screen Report
Report Summary highlights basic information about the ColorQPC sessions involved such as Setting preset, Swatchbook, Rendering Intent, etc..
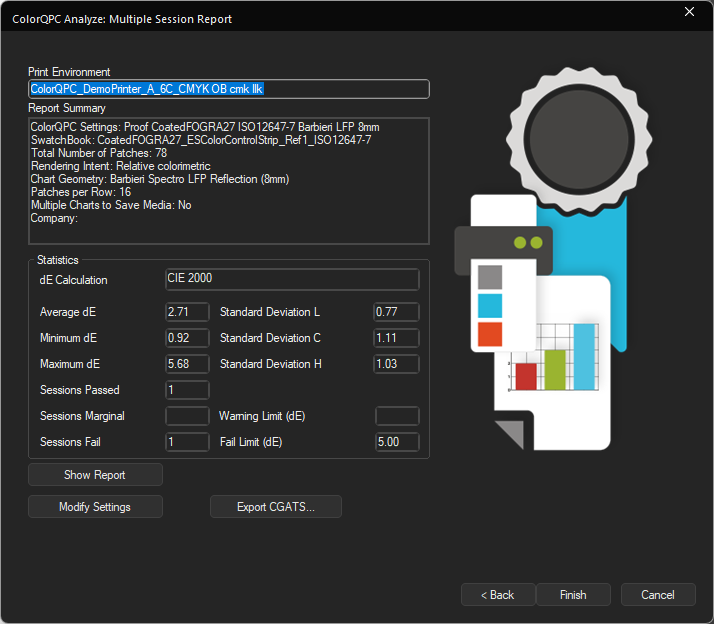
The Statistics section provides overall data for all evaluated sessions and Indicates the number of passing, marginal and failing sessions.
Clicking Show Report displays an HTML version of the report (Description see next step).
Modify settings lets you temporarily view and change to the statistics and report options (description see section “ColorQPC Setup Details”) for testing purposes.
Click Finish or Cancel to close the dialog.
HTML Report
Clicking on the Show Report Button in the Measurement Session Report generates an HTML report of the measurement that displays an in-depth summary of the measurement and comparison:
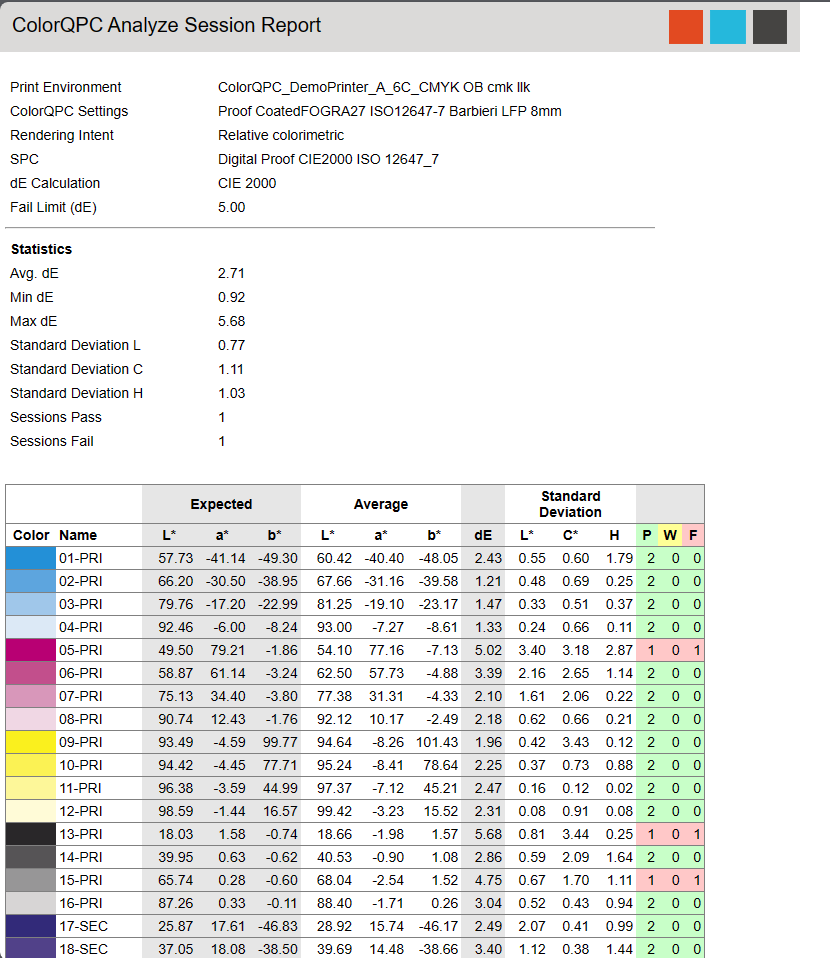
The top half of the report displays information about the ColorQPC Analyze session like the Print Environment, Statistics, overall Status (Red, Yellow, Green) and the ColorQPC Settings.
The table in the bottom section displays the list of colors printed including an approximate preview of the color, the name of the color defined in the Swatch book or Named Colors, the expected Lab values, the measured Lab values, and the color difference (dE) between the expected and measured results, the standard deviation in dE between the expected and measured results, and the analysis results for each color in all the evaluated sessions.
The color coding used in the dE column designates whether a color passed the evaluation:
- Gray indicates out-of-gamut colors (Only shown if comparison done to expected values),
- Green indicates this color passed for all evaluated sessions,
- Yellow indicates thiscolor was higher than the warning limit in one or more sessions, and
- Red indicates this color exceeded the fail limit in one or more sessions.
Examples for ColorQPC Workflows
Checking Profiles
ColorQPC is a powerful tool to check the color accuracy of your color profiles and how well it can reproduce different colors. To evaluate a color profile, use the following procedure:
Select the print environment with the ICC color profile you want to test. Doublecheck that the profile is active in the Print Environment under Print Environment Settings > Quality.
Launch ColorQPC Measure in Tools > Color & Special Features > ColorQPC > Measure and Compare.
Select a ColorQPC Setting. We generally recommend starting with one of the standard default settings as a base (e.g. Digital Textile Standard Quality Barbieri LFP 8mm).
If necessary, edit the settings to work with a specific color measurement device by clicking the edit button next to the ColorQPC Settings menu.
Change reporting options if desired.
Create a new measurement session.
Follow the process in this article to print and measure the session.
Select the Compare with expected values option in the Compare Measurements dialog.
Create a Report to assess results.
If you want to really put your profiles to the test, you can also repeat this process with one of the high-quality default ColorQPC Settings. Please note that the inherent color repeatability of some printer, ink and media combinations may be lower than the warning and fail limits in the high quality default settings, so passing high quality tests across the board might not be possible in some circumstances.
Process Control
In digital print production, consistency of color results is key. To help ensure that your results remain consistently high, ColorQPC offers tools to check your process over time to make sure your print output remains within set tolerances. The following procedure describes a method to observe color process control tolerances with ColorQPC.
This procedure assumes that the color profile in the print environment was created for the printer, ink and media combination used for process control monitoring.
Create Baseline Measurement Sessions
In this monitoring process, periodic measurement sessions are done over time to observe and ensure the color repeatability of the current process.
Select the print environment profile you want to monitor. Doublecheck that print environment is for the printer you use in production.
Launch ColorQPC Measure in Tools > Color & Special Features > ColorQPC > Measure and Compare.
Select a ColorQPC Setting. We generally recommend starting with one of the standard default settings as a base (e.g. Digital Textile Standard Quality Barbieri LFP 8mm).
If necessary, edit the settings to work with a specific color measurement device by clicking the edit button next to the ColorQPC Settings menu.
Change reporting options if desired.
Create a new measurement session.
Follow the process in this article to print and measure the session.
Select the Show measurements only option in the Compare Measurements dialog.
Finish and save session.
Repeat the process to create, print, and save measurement sessions with the same printer, ink type, media type, Print Environment, and ColorQPC setting on a shift or daily basis for at least 5 shifts or 5 days.
Increasing the number sessions will provide more realistic information about the process.
Compute Baseline Warning and Fail Limit Statistics
Using the measurements from the the baseline, the overall warning and fail limits can be computed for the process.
Select the desired print environment as when creating the baseline.
Launch ColorQPC Analyze and Monitor.
Select ColorQPC Setting and print environment used in Step I.
Generate the Multiple Session Report.
Record the average dE and standard deviation values in the report.
Compute a baseline warning limit by multiplying the standard deviation by 2 and adding this value to the average dE. Compute a baseline fail limit by multiplying the standard deviation by 3 and adding this value to the average dE.
For example:
Average dE = 4
Standard Deviation = 0.75
Warning Limit = 4 + (0.75*2) = 5.50
Fail Limit = 4 + (0.75*3.0) = 6.25
Close ColorQPC Analyze.
Please note that high average and/or standard deviation values may be a sign that either the profile is incorrect or that there are problems with the printing process. A high average value indicates that colors are being printed incorrectly in every session while a high standard deviation is a symptom that the printing process has a large degree of variability between sessions.
Update Warning and Fail Limit Statistics in ColorQPC Settings
Based on the calculations done in the previous step, we now know the appropriate warning thresholds for our print results. Next, we’ll need to set these thresholds in our ColorQPC settings so they are applied to our measurements.
Select the Print Environment used when creating the baseline.
Launch ColorQPC Measure.
Edit the ColorQPC Setting used in Step I. for the baseline measurement sessions.
Go to the Statistics tab. Enter the warning and fail limit values computed in Step II and click OK.
Process Control
With the updated ColorQPC Setting, subsequent measurement sessions can now be compared to the baseline statistics from the previous step.
Create a new measurement session using the print environment and the ColorQPC Setting modified in the previous step.
Follow the process in this document to print and measure the session.
Select the Compare with expected values option in the Compare Measurements dialog.
Create a Report for the session. If the report results in a warning message, it is worthwhile to check which colors are out-of-tolerance. A fail message would indicate a printing error or unexpected change in the printing process.
Related Articles
Import Settings from Ergosoft 15 and 16
Updating from an earlier version of a RIP to a more recent one can seem like a daunting task, but with the following steps you can easily take over your printer configurations and settings from Ergosoft RIP 15 to Ergosoft 17. It is recommended to do ...